
1811-5209/23/0019-0352$2.50 DOI: 10.2138/gselements.19.6.352
Keywords: Mineralogy; texture; elemental deportment; liberation; ore characterisation
INTRODUCTION
Before the invention and implementation of the geometallurgical approach, the exploration and mining industry had relied largely on a traditional element-based methodology to evaluate commercially important mineral deposits. This involved a simple but cost-effective approach whereby samples were submitted for chemical assays (e.g., XRF, ICP-OES, ICP-MS, see Table 1 for abbreviations) for the elements of interest. For example, in a gold exploration program, key elements such as Au, Ag, and As would be of main concern, while Pb, Zn, Fe, Ag, and As would be important for a Pb–Zn deposit. Only the most essential elemental assays were commissioned, largely to save time and money. Whilst this was considered practical at the time, and often worked to some degree for most ore bodies, ore characterisation is best served by more than just chemical assays. This is because, at the fundamental level, we mine minerals and not elements; in addition, we process complex particles and not pure mineral grains. This leads to the inevitable conclusion that, to fully understand, predict, and improve the performance of an ore during its life cycle from extraction to marketable products and waste, the geology, mineralogy, texture, elemental deportment, and breakage characteristics must be known and their effects on processing well understood.
A cursory look at geometallurgy may suggest that it is simply what was previously called ‘ore characterisation’, but it is far more than that today. Technology has developed in the last ~20 years such that ores can now be imaged and analysed in 2D and 3D, at high resolution, and in practical time frames, providing all the key parameters to optimise mineral processing and extraction. There are many types of samples that can be investigated with modern analysis and imaging methods for geometallurgical purposes. Mobile or hand-held devices can be used in the field for in-situ material (e.g., outcrop, mine-face). Once removed from their geological and physical context and transported to a mineral processing plant or analytical laboratory, ex-situ samples can be examined online, in-line, and in 3D- and 2D-sections (Dehaine and Esbensen 2022).
MINERAL AND ORE GEOMETALLURGICAL PROPERTIES
We often make the distinction between primary ore properties (intrinsic to the ore), as opposed to secondary properties (describing ore behaviour during processing; Frenzel et al. 2023 this issue). The current paper focuses on primary ore properties as measured by geochemical and mineralogical analysis, while secondary ore properties, which are quantified as the response to a geometallurgical test and are used to predict the performance of the mineral processing and metallurgical operations, are described in Pereira et al. (2023 this issue). Both primary and secondary properties of ores are directly linked to the minerals making up the ore and their respective mineral properties. While minerals are characterised by numerous different properties, only a few are relevant for mineral processing and metallurgy: hardness, density, magnetic susceptibility, electrical conductivity, hydrophobicity, and chemistry (cf. Pereira et al. 2023 this issue; Chetty et al. 2023 this issue; Fig. 1).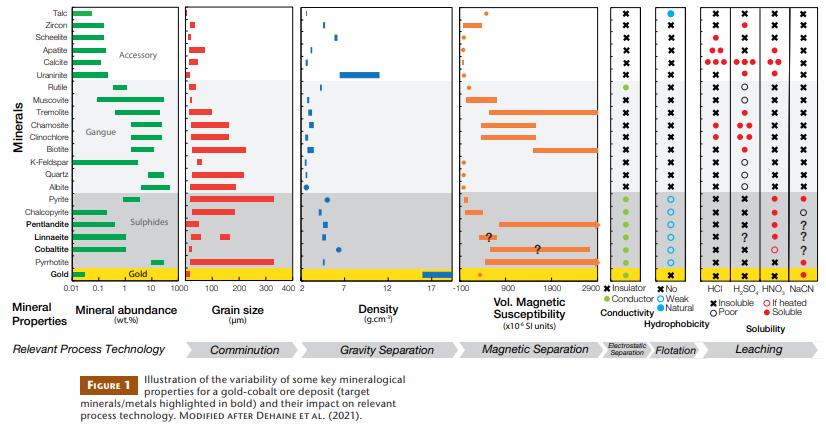
Key ore properties, which need quantification before processing, include elemental assay, modal mineralogy, grain size, grain shape, mineral associations, elemental deportment, and the presence of deleterious minerals (e.g., clays, asbestiform minerals, or minerals containing elements that cause contamination or harm to the environment (so-called penalty elements)). The same parameters can be established for ore particles generated by comminution, along with particle shape and size, and degree of liberation of key phases (by surface area or volume). Finally, materials that have been subjected to further downstream physical and chemical processes can be scrutinised in detail for purity, losses, and potentially harmful minerals or elements (cf. Parbhakar-Fox and Baumgartner 2023 this issue).
MINERALOGICAL CHARACTERISATION
Methods of Mineral Characterisation
An overwhelming number of modern geoanalytical techniques are available for the imaging and analysis of Earth materials, including ore (Table 1). To evaluate them, it is often useful to consider the type of energy source on which they are based, as this determines their practicality, capabilities, and applications. For convenience, we consider the following types of sources (Fig. 2): visible and non-visible light (optical imaging, hyperspectral); X-rays (XRD, XRF, X-CT, micro-XRF); electron beams (SEM, SEM-EDS, automated mineralogy, EPMA), laser beams (Raman, LA-ICP-MS, LIBs, FTIR), and ion beams (FIB-SEM). See Table 1 for abbreviations.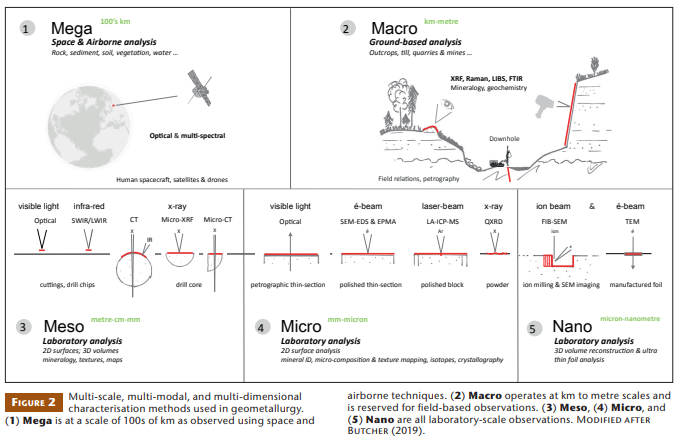
Optical systems have been around since the invention of the petrographic microscope by Henry Clifton Sorby in 1848 and continue to provide a sound basis for mineral identification and textural descriptions. Many commercially important minerals can be readily identified optically. The big drawback to the technique is its dependence on the skills and output of the microscopist, and as with most single-exertion activities, the difficulty to upscale the output. There are also limitations to what the human eye can discriminate and record, which are not consistent between different individuals. It was on this basis that new microscopes were developed that offered operator-independent analysis with higher-magnification imaging capabilities, and higher productivity, such as the modern scanning electron microscope (SEM) developed in the 1930s.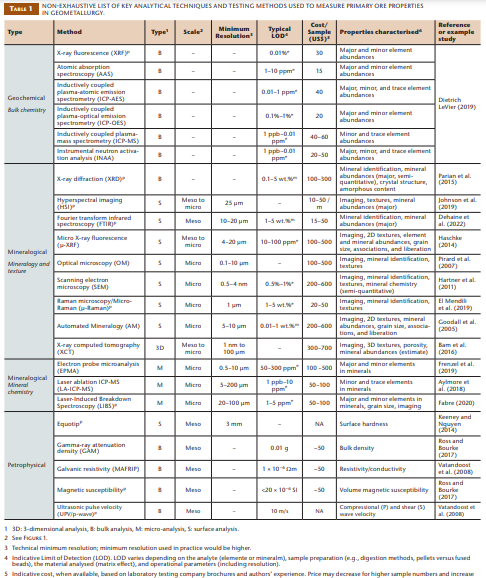
In more recent times (1980s onwards), this has led to a new field known as automated mineralogy, which utilises both the imaging capabilities of the SEM along with the possibility of conducting micro-chemical analyses along pre-defined lines, grids, or points (electron-based mineral identification, or SEM-EDS), allowing automated data capture on polished surfaces of solid samples or particulates at the micrometre-scale, and at a rate and quantity that is not humanly possible.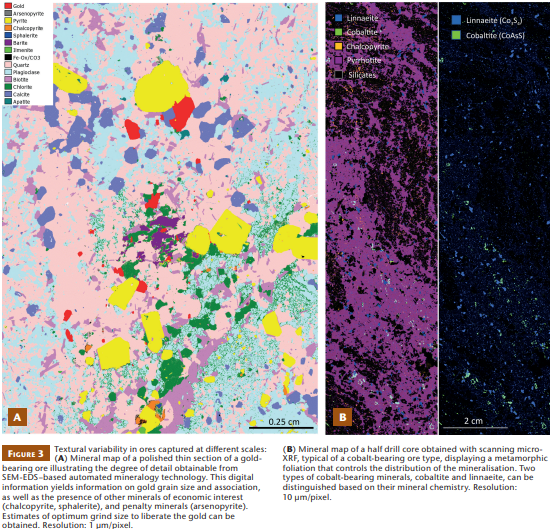
The further advantage of the SEM-based approach is that hundreds, thousands, and in some cases even millions of EDS spectra can be digitally processed both online and off-line using dedicated analytical software to provide quantitative mineralogical and petrographic data for use in geometallurgy. The main outputs are digital images of the sample under investigation (Fig. 3), where the composition of each pixel is known, as well as its associations with neighbouring pixels. Thus, modal mineralogy, as well as textural and chemical attributes, can be determined on a pixel-by-pixel basis. Surface mineral maps can be created for polished thin-sections or polished sample blocks up to decimetre-size, providing mineralogy within a textural context. Particle-by-particle analysis is also possible for particle mounts of crushed and processed samples (Fig. 4). Given the high level of measurement automation, statistically valid measurements can be undertaken, which provide quantitative estimates of mineral mode, particlegrain sizes and shapes, liberation, association, elemental deportment, and calculated assay.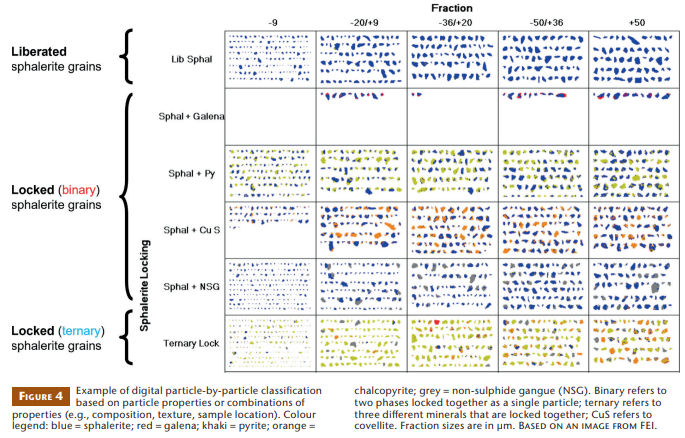
If upscaling of textural and mineralogical characteristics from the micrometre- to the metre-scale is of interest, hyperspectral methods are now also available and widely used, e.g., visible-near infrared (VNIR) and shortwave infrared (SWIR), and can be deployed in combination with other technologies. Specifically, scanning micro-XRF is now available with mineralogical and elemental capabilities such that drill cores, for example, can be evaluated at micrometre scales over centimetre to metre distances, either directly on the curved surface, or on a 2D cut surface. Thus, a core pulled straight from the ground (and ideally orientated appropriately) can be used to generate first estimates of mineralogy and potential liberation behaviour of the commercially important minerals in an ore before further (usually destructive) testing is performed.
Stereological Bias in 2D Measurements
Most of the above-mentioned techniques rely on 2D image analysis, which is the current industry standard. However, when measuring 3D objects via 2D sections, a stereological bias inevitably occurs (Gottlieb et al. 2000). This phenomenon mostly concerns the estimation of apparent grain size and apparent liberation (Fig. 5). The sectioning of grains in a polished mount always results in a 2D sectional view where the apparent grain size is less than or equal to the true size of the grains (Fig. 5A; Sutherland 2007). Similarly, the measured apparent liberation in 2D measurements overestimates true 3D liberation (Spencer and Sutherland 2000). Indeed, a liberated grain always appears liberated in sectional views, whereas locked grains can appear to be liberated or locked in sectional views depending on where the section cuts the particle in which they are locked (Fig. 5B).
The magnitude of the stereological bias for liberation estimates will vary with particle size, texture, and actual liberation. The bias will be important for particles with a simple texture (e.g., binary or ternary particles, as in Fig. 5B), but virtually negligible for fully liberated grains (e.g., Fig. 5A). The effects of stereological bias can be controlled by careful sample preparation, including sizing of the samples and mounting of the size fractions in distinct polished mounts for liberation analysis (Spencer and Sutherland 2000). While some authors have suggested that the effects of stereological bias are minimal in most real cases (e.g., Petruk 2000), it is not trivial to assess how strong its effect will be in any specific case. Therefore, some authors have developed correction methods to account for the effects of stereological biases (Gay and Morrison 2006). However, only 3D techniques such as X-ray computed tomography (XCT) may ultimately overcome the effects of stereological bias. Indeed, XCT has the ability, if the density contrast between minerals is suitable, to directly measure the 3D liberation of grains. The method does, however, have some limitations in terms of spatial and phase resolution (Table 1), and the liberation of small grains in a complex particle may be difficult to resolve.
Sampling
The granular nature of geological and processing samples may introduce significant sampling errors. If not controlled for, these may be orders of magnitude higher than the typical analytical errors of the analytical techniques described above. Obtaining a representative sample is therefore of paramount importance in ore characterisation, as no amount of measurement, even with many different techniques, can compensate for inadequate sampling. While we do not have space to delve into this topic more deeply here, the Theory of Sampling (TOS) developed by Pierre Gy (1998) provides a comprehensive introduction to this issue, including protocols for the sampling and preparation of geological materials to ensure representative results.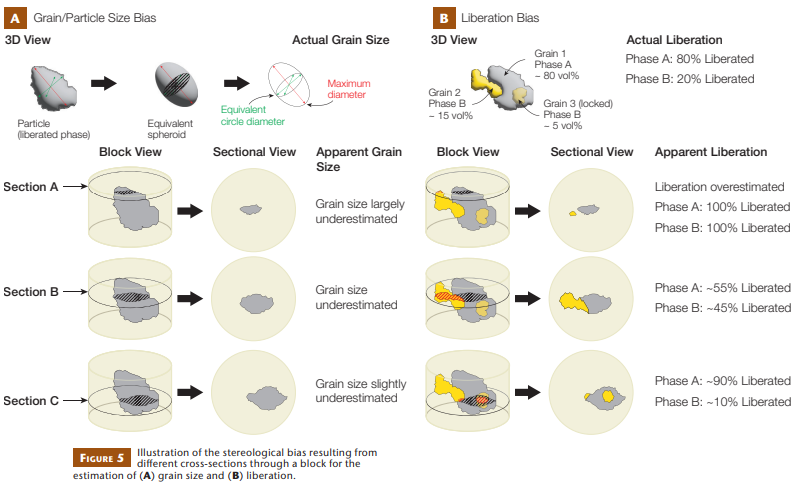
DATA INTEGRATION OVER DIFFERENT LENGTH SCALES AND MODALITIES
It is common practice in other disciplines of science and engineering, where complex imaging and analysis are required, to create what are known as workflows. This is a concept where samples are examined in a particular order using a variety of techniques, providing multi-scale, multi-modal, multi-dimensional, and multi-disciplinary information. Geometallurgy is ideally suited to adopt this approach given that rock textures and ore types are developed at different scales of observation. We might, for example, need to know information at the grain boundaryscale (for liberation or processing behaviour), as well as at the ore deposit–scale (for resource modelling). It is only by using the workflow approach that we can bridge these important scales of observation.
The order in which the different technologies and methods are applied usually follows the scale, from macro to micro, and from in-situ non-destructive methods to bulk or destructive methods. The choice of techniques depends on the type of information needed. Some workflows may include, for instance, two distinct methods that may seem redundant, like two (semi-) quantitative mineralogical analytical methods, e.g., XRD with Rietveld refinement (QXRD) and automated mineralogy. But each method has its advantages and limitations. XRD is often better at phase identification than automated mineralogy and furthermore can differentiate polymorphs like pyrite and marcasite. Typically, XRD cannot quantify amorphous phases (unless an internal crystalline standard is used), or minor and trace minerals below 1–3 wt.% abundance (Table 1). However, XRD phase quantification includes crystallites down to the nanometre scale, while SEM-based automated mineralogy systems typically only cover mineral grains down to 2 µm. Thus, both methods are complementary and should be used together.
It is also necessary to ensure in multi-method analysis that the methods are cross-validated and calibrated. This is achieved by taking a sample and analysing the same representative aliquot by more than one method and checking for the consistency of results, e.g., XRF, QXRD, Raman, and ICP-MS in the case of powders; or optical microscopy, SEM-EDS, micro-XRF, and EPMA, combined with image registration software, in the case of the 2D surface of a thin section or polished block.
In addition, the modal mineralogy data obtained by automated mineralogy can be combined with mineral chemistry data obtained by EPMA to back-calculate the bulk chemistry of each sample based on its mineralogical composition. This can then be compared to the measured bulk chemistry of the sample obtained by bulk chemical analyses (e.g., XRF and ICP-OES/MS) to cross-validate the results, and to refine modal mineralogy data, the accuracy of which is often an order of magnitude below those of chemical analytical methods.
The result of such an integrated multi-scale approach is to have full visibility of all minerals present over any relevant scale and, thus, knowledge of how they occur (Figs. 1 and 2).
NEW TECHNOLOGIES AND FUTURE DEVELOPMENTS
Going forwards, geometallurgy will depend more (not less) on geological-, mining-, and minerals engineering–related data being made available. This will require continued development in the improvement of analytical techniques, the speed of data acquisition and processing, as well as data handling, archiving, and retrieval architectures for geologists, mineralogists, miners, and processors. The faster, cheaper, and more efficient collection of information will also enable better interdisciplinary collaboration along the processing chain.
Whole core scanners are already available that can produce a 3D archive of drill cores in practicable time frames. Hyperspectral scanning has also advanced in recent years, and now offers the possibility of near real-time analysis. Scanning micro-XRF has the potential to make mineral and texture maps of entire drill core trays and provide mineral and liberation information at, or near, the drillsite. Nevertheless, we still lack the ability to comprehensively scan drill cores and process the acquired data at a rate that keeps up with drilling and allows for immediate access to the processed and interpreted data for decision makers. Indeed, this is a field where active developments are occurring at the time of writing, and great improvements are expected over the next few years.
Based on these increasing rates of data acquisition for primary ore properties, and increasing diversity of available data types, geometallurgy will likely continue to contribute to the design of ever more sophisticated mineral processing plants. Ideally, geometallurgical campaigns should efficiently establish the mineralogical and textural signatures, including their variability, for the main ore types, each with different processing performances, along with secondary properties (cf. Pereira et al. 2023 this issue), which together can be used to estimate overall process performance.
In a mineral processing plant, the different ore types, or even specific ore properties, will then ideally be identified with characteristic spectral measurements. For example, a combination of XRF, FTIR, and Raman spectrometry may be measured by an instrument cluster positioned over the mill feed belt that could estimate the proportions of the different ore types entering the mill. An automation system would then influence the speed and fill rate of the mill.
The ultimate outcome of all these measurements, monitoring, and associated optimisation routines, will be the highly efficient recovery of minerals of commercial interest. However, to fully achieve this potential, geometallurgy must take full advantage of developments in artificial intelligence to process the big data sets generated in modern mines. This is starting to occur at the time of writing, and we anticipate new breakthroughs in the upcoming years.
ACKNOWLEDGMENTS
The authors are grateful to Mawson Gold Oy for access to their drill core and for permission to publish the results. Some of the data presented here were generated as part of the BATCircle Project [grant no. 4853/31/2018]. Peter Sorjonen-Ward is thanked for the sample featured in Figure 3A, and Gavyn Rollinson is acknowledged for the associated digital automated mineralogy image. GTK’s Science & Innovation Directorate is thanked for the generous funding of this paper.
REFERENCES
Aylmore MG and 7 coauthors (2018) Applications of advanced analytical and mass spectrometry techniques to the characterisation of micaceous lithium-bearing ores. Minerals Engineering 116: 182-195, doi: 10.1016/j. mineng.2017.08.004
Bam C, Miller JA, Becker M, De Beer FC, Basson IJ (2016) X-ray computed tomog-raphy-determination of rapid scanning parameters for geometallurgical analysis of iron ore. In: Proceedings, 3rd AusIMM International Geometallurgy Conference, Perth, pp 209-219
Butcher AR (2019) Upscaling of 2D miner – alogical information to 3D volumes for geoscience applications using a multi-scale, multi-modal and multi-dimensional approach. IOP Conf. Series: Materials Science and Engineering 891: 012006, doi: 10.1088/1757-899X/891/1/012006
Chetty D, Nwaila GT, Xakalashe B (2023) Fire and water: geometallurgy and extractive metallurgy. Elements 19: 365-370
Dehaine Q, Esbensen KH (2022) Multivariate methods for improved geometallurgy sampling. TOS Forum 11: 411, doi: 10.1255/tosf.167
Dehaine Q, Farajewicz M, Michaux SP, Butcher AR, Cook N (2021) Geometallurgical characterisation of the Rajapalot Au-Co Project. BATCircle Project Report 04, GTK Finland, 27 pp
Dehaine Q, Tijsseling LT, Rollinson GK, Buxton MWN, Glass HJ (2022) Geometallurgical characterisation with portable FTIR: application to sediment-hosted Cu-Co ores. Minerals 12: 15, doi: 10.3390/min12010015
Dietrich LeVier M (2019) Analytical techniques. In: Dunne RC, Kawatra SK, Young CA (eds) SME Mineral Processing and Extractive Metallurgy Handbook. Society for Mining, Metallurgy & Exploration, Englewood, pp 19-42
El Mendili Y and 8 coauthors (2019) Combined XRF, XRD, SEM-EDS, and Raman analyses on serpentinized harzburgite (nickel laterite mine, New Caledonia): implications for exploration and geometallurgy. ACS Earth and Space Chemistry 3: 2237-2249, doi: 10.1021/ acsearthspacechem.9b00014
Fabre C (2020) Advances in laser-induced breakdown spectroscopy analysis for geology: a critical review. Spectrochimica Acta B: Atomic Spectroscopy 166: 105799, doi: 10.1016/j.sab.2020.105799
Frenzel M and 5 coauthors (2019) The geometallurgical assessment of by-products – geochemical proxies for the complex mineralogical deportment of indium at Neves-Corvo, Portugal. Mineralium Deposita 54: 959-982, doi: 10.1007/s00126-018-0849-6
Frenzel M, Baumgartner R, Tolosana-Delgado R, Gutzmer J (2023) Geometallurgy: present and future. Elements 19: 345-351
Gay SL, Morrison RD (2006) Using two dimensional sectional distributions to infer three dimensional volumetric distributions – validation using tomog-raphy. Particle & Particle Systems Characterization 23: 246-253, doi: 10.1002/ppsc.200601056
Goodall WR, Scales PJ, Butcher AR (2005) The use of QEMSCAN and diagnostic leaching in the characterisation of visible gold in complex ores. Minerals Engineering 18: 877-88, doi: 10.1016/j. mineng.2005.01.018
Gottlieb P and 9 coauthors (2000) Using quantitative electron microscopy for process mineralogy applications. JOM 52: 24-25, doi: 10.1007/s11837-000-0126-9
Gy P (1998) Sampling for Analytical Purposes. Wiley, 176 pp
Hartner R, Walters SG, Berry R (2011) Optical and SEM-based microscopy integration for optimisation of geometallurgical model-ling and ore deposit characterisation. In: Proceedings, 1st AusIMM International Geometallurgy Conference 2011, pp 157-162
Haschke M (2014) Laboratory Micro- X-ray Fluorescence Spectroscopy: Instrumentation and Applications. Springer, 356 pp
Johnson CL, Browning DA, Pendock NE (2019) Hyperspectral imaging applica-tions to geometallurgy: utilizing blast hole mineralogy to predict Au-Cu recovery and throughput at the Phoenix mine, Nevada. Economic Geology 114: 1481-1494, doi: 10.5382/econgeo.4684
Keeney L, Nguyen K (2014) The use of EQUOtip as a hardness domaining tool. In: Proceedings of the XXVII International Mineral Processing Congress, pp 128-138
Parbhakar-Fox A, Baumgartner R (2023) Action versus reaction: how geometal-lurgy can improve mine waste manage-ment across the life-of-mine. Elements 19: 371-376
Parian M, Lamberg P, Möckel R, Rosenkranz J (2015) Analysis of mineral grades for geometallurgy: combined element-to-mineral conversion and quantitative X-ray diffraction. Minerals Engineering 82: 25-35, doi: 10.1016/j.mineng.2015.04.023
Pereira L, Schach E, Tolosana-Delgado R, Frenzel M (2023) All about particles: modelling ore behaviour in mineral processing. Elements 19: 359-364
Petruk W (2000) Applied Mineralogy in the Mining Industry (First Edition). Elsevier, 288 pp
Pirard E, Lebichot S, Krier W (2007) Particle texture analysis using polar-ized light imaging and grey level inter-cepts. International Journal of Mineral Processing 84: 299-309, doi: 10.1016/j. minpro.2007.03.004
Ross PS, Bourke A (2017) High-resolution gamma ray attenuation density measure-ments on mining exploration drill cores, including cut cores. Journal of Applied Geophysics 136: 262-268, doi: 10.1016/j. jappgeo.2016.11.012
Spencer S, Sutherland D (2000) Stereological correction of mineral liberation grade distributions estimated by single sectioning of particles. Image Analysis and Stereology 19: 175-182, doi: 10.5566/ias. v19.p175-182
Sutherland D (2007) Estimation of mineral grain size using automated mineralogy. Minerals Engineering 20: 452-460, doi: 10.1016/j.mineng.2006.12.011
Vatandoost A, Fullagar P, Roach M (2008) Automated multi-sensor petrophysical core logging. Exploration Geophysics 39: 181-188, doi: 10.1071/EG08020